




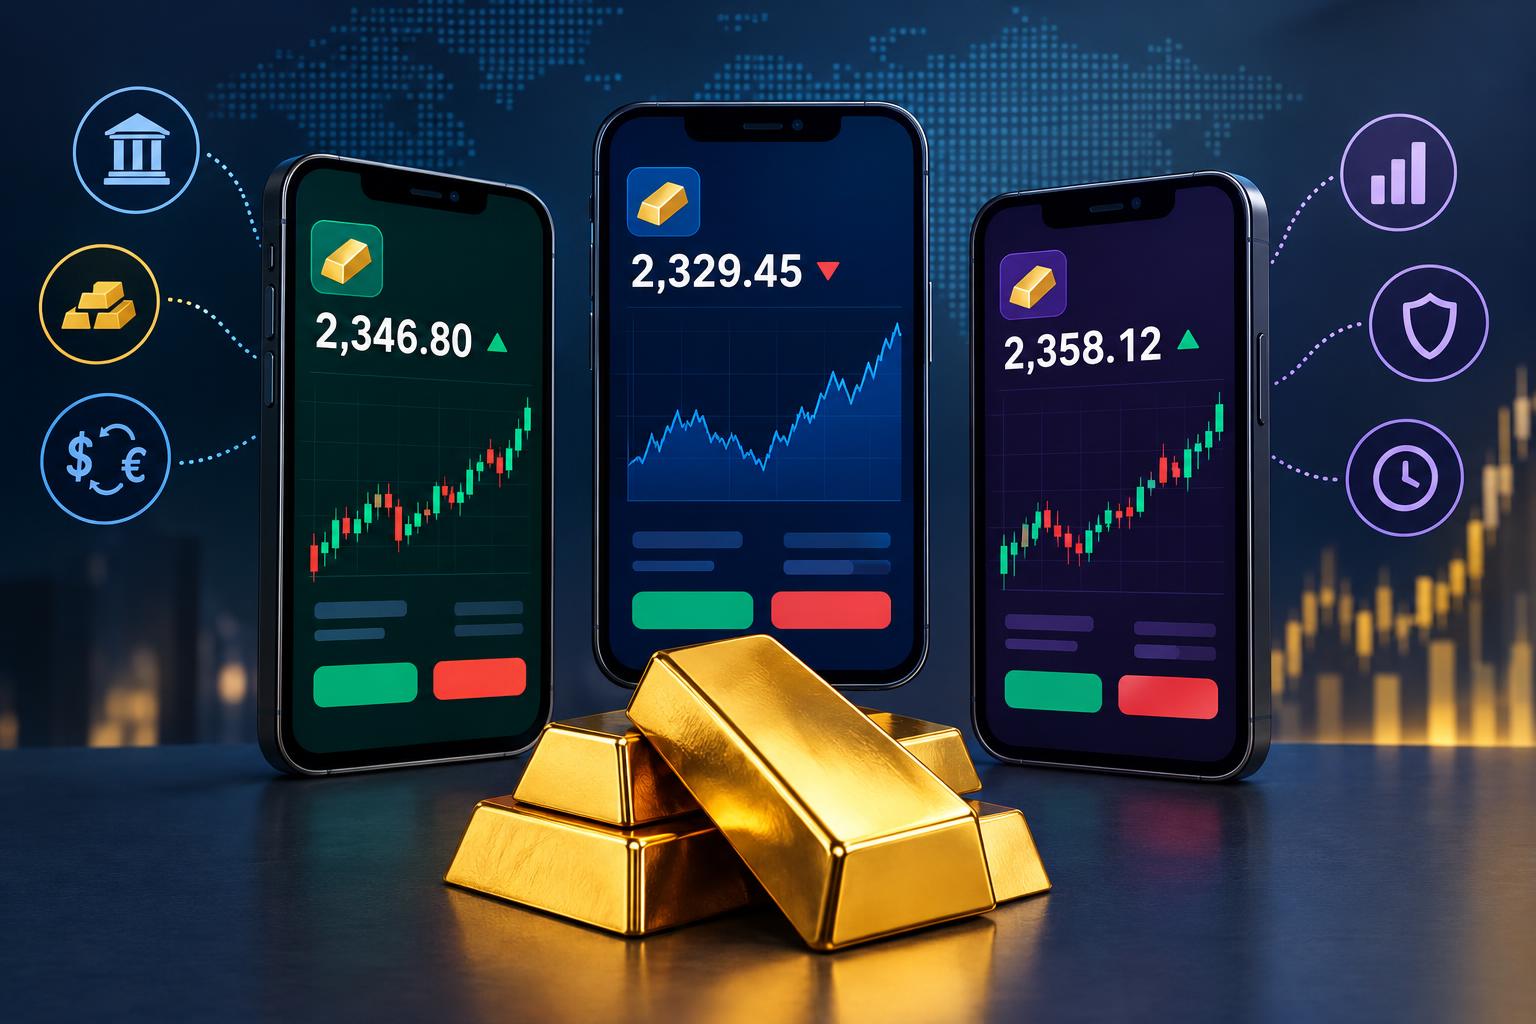
Open two trading apps, search for gold, and the numbers may not match. One screen shows a slightly higher price. Another chart seems to move a few seconds later. A financial news page displays a third figure, even though all three appear to describe the same market.
These differences can be confusing, especially when the interfaces use similar labels. However, “gold price” can refer to several types of data. The instrument, quote source and display settings all affect the number on the screen.
Before deciding that an app is inaccurate or that one platform offers a better price, it helps to understand what each quote actually represents.
Start with the instrument behind the label
A search for “gold” can return a spot quotation, a futures contract, a contract for difference, or shares in a fund that holds gold. These products are connected to the metal, but their prices are not interchangeable.
A spot quotation refers to gold for near-term settlement. A futures contract refers to a particular contract month and has defined exchange rules. A gold-backed fund trades in shares, so the price of one share does not represent the price of one ounce.
The symbol XAUUSD commonly appears on trading platforms. It expresses gold’s value in US dollars per troy ounce, but the symbol alone does not explain every contractual detail. NordFX’s guide to what XAUUSD represents provides an introduction to the quotation. The platform’s own instrument specification then explains what users can actually trade.
A chart price is not always a buying price
Trading interfaces often place one large number above a chart. That makes the screen easy to read, but it can hide a distinction between the bid, ask and last traded price.
The bid is the quoted price at which a trader can sell, subject to available liquidity and execution conditions. The ask is the corresponding buying price. The difference between them is the spread.
The last price records the most recent completed trade. It is historical information, even when the trade occurred a fraction of a second ago. It does not necessarily show the price available for the next order.
Consider an illustrative quotation of 3,000.00 bid and 3,000.40 ask. An app showing the bid displays 3,000.00. Another showing the midpoint displays 3,000.20. Both can be presenting valid information from the same quotation.
Chart construction also varies. MetaTrader 5 documentation distinguishes between charts built from bid prices and those built from last traded prices. Users can check the chart mode in the instrument details.
For a meaningful comparison, match bid with bid or ask with ask. Comparing a chart’s last price with another app’s buying quote can create a misleading impression of the difference.
Check when the quote was updated
Two screens viewed at the same moment may contain information from different moments.
Some services provide streaming quotes. Others refresh periodically or display delayed market data. A page can look active because its interface updates while the underlying price feed remains delayed.
Smaller timing differences can arise from the connection between the data provider, the app’s servers and the user’s device. A weak internet connection or an app resuming after running in the background may leave an older quote visible until the feed reconnects.
Look for a timestamp and any label identifying delayed data. If prices appear frozen, check the connection status before drawing conclusions about the market. A screenshot without a timestamp often lacks the information needed to investigate a discrepancy.
Different providers can supply different quotes
Even when two apps show live spot-based gold prices, they may obtain those prices from different sources.
The global spot gold market does not have one universal retail quote that every provider must reproduce. An app may display an indicative reference feed, while a broker supplies tradable bid and ask prices drawn from its pricing arrangements.
Providers can also differ in how they combine incoming quotes, filter unusual price updates and apply account-specific spreads. As a result, small differences can remain after the instrument and timestamp have been matched.
The distinction between an indicative price and an executable quote matters here. A market-information app may show where its source places gold without offering any transaction at that number. A broker’s order screen presents prices under that broker’s trading conditions.
That does not make every discrepancy harmless. A persistent or unusually large gap deserves an explanation. However, the useful question is which feeds and pricing rules are being compared, rather than which screen looks more convincing.
Futures charts need an extra check
Gold futures have contract months. Two apps may both display “gold futures” while selecting different months.
A contract approaching expiry and a later-dated contract can trade at different prices. Financing and storage costs, along with market supply and demand, help explain why a futures price can differ from a spot quotation.
Some charting services display a continuous futures series. This joins successive contracts into one chart so users can examine a longer history without switching symbols manually.
The change from one contract to the next is called a rollover. Chart providers may use different rollover dates or adjust historical prices differently. Consequently, two continuous charts can show different historical levels even when they follow the same futures market.
Check the contract month and whether the chart is adjusted. A continuous chart is useful for analysis, but it is not itself a single contract that can be bought or sold throughout its entire history.
Chart settings can change the visual story
Sometimes the latest prices are close, yet the candles look noticeably different.
The reason may be the chart’s time zone or the way trading sessions are divided. A daily candle groups price activity within a defined period. If two providers start that period at different times, their daily opening and closing prices can differ.
Shorter timeframes can also reveal differences in the underlying data. One feed may record a brief price update that another feed does not include. That can produce a different candle high or low.
Display precision adds another small complication. One app may round a quote to two decimal places while another displays more digits. Extra decimal places do not, by themselves, prove that a feed is more accurate.
Before comparing chart patterns, align the timeframe, price type and time zone where possible. For futures, also align the contract and adjustment settings. Otherwise, a visual comparison may combine several unrelated differences.